Tracking portfolio allocation
Financial independence is one of the core values in the Osipov household. We invest for the long term and maintain a stock-to-bond ratio that reflects our goals and risk tolerance. However, over time, the ratio gets out of date, and we use a handy spreadsheet to catch the imbalance and inform our adjustments.
It’s no secret that I love tinkering with spreadsheets: we keep a master spreadsheet which tracks our networth, income, expenses, mortgage, allocation, and any other little thing our heart desires. We perform a major annual financial review around New Year’s Eve, complete with presentations and champagne - it’s quite an event, and yes, we’re dorks. It’d be much harder to extract insights without diligent record-keeping throughout the year.
Each year we make a new copy of the spreadsheet, and we’re on 9th iteration at this point. Initially our spreadsheet was based on IndyPendent’s One Sheet to Rule Them All, but we’ve diverged quite a long time ago.
Here’s a screenshot of the sheet we use for tracking allocation within our portfolio and as a guide for occasional rebalancing (with some sample data filled in):
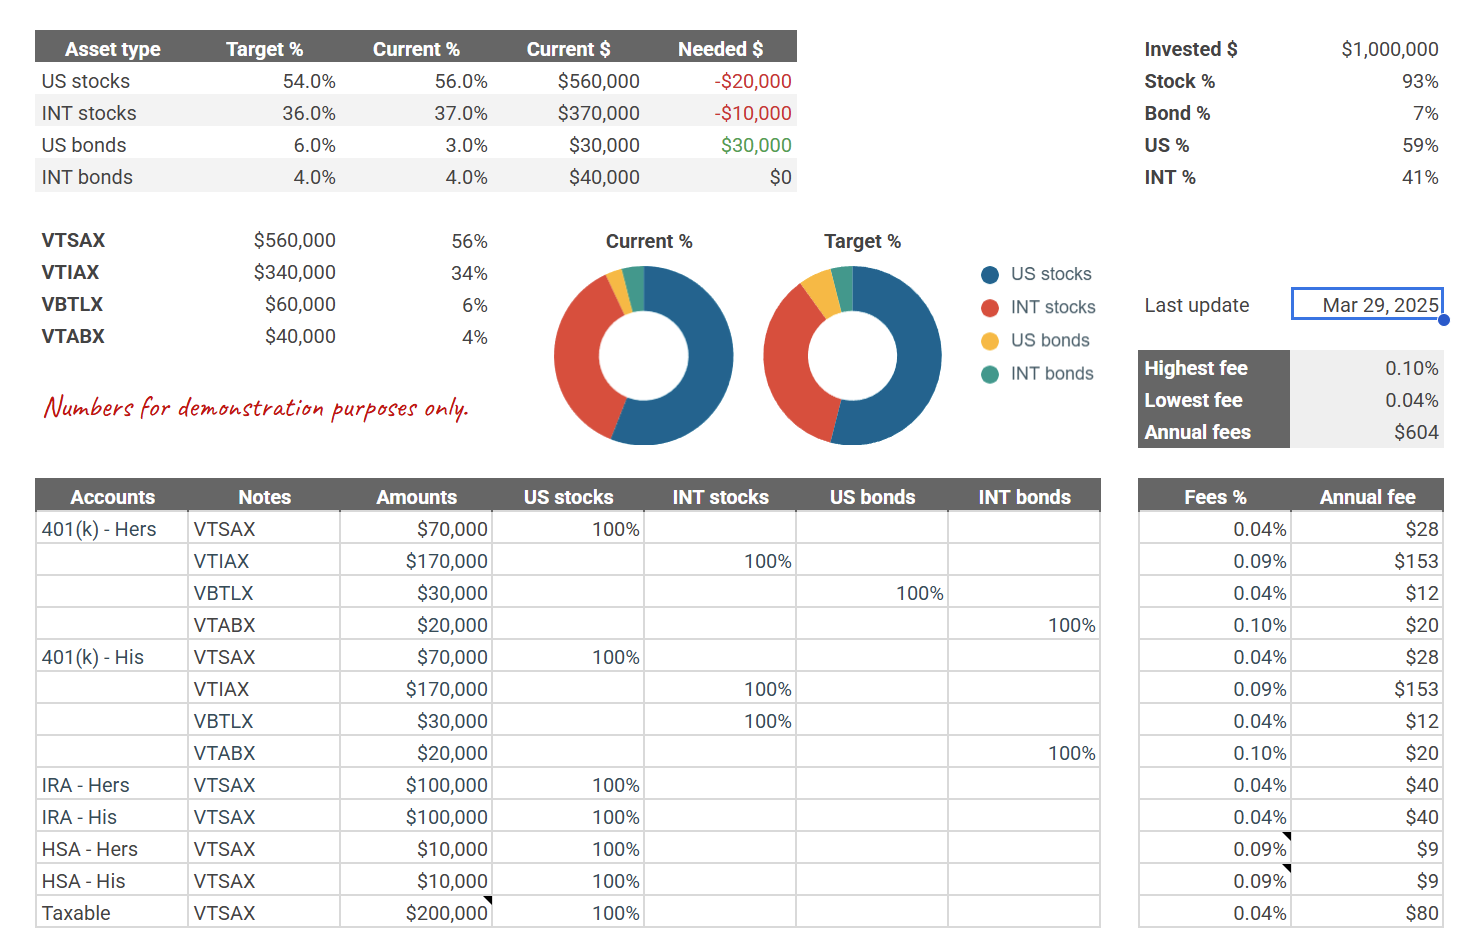
It allows me to set targets and see our current distributions: we care about stocks vs bonds split as well as US vs international market. It’s simple, manual, but has been working well for us. Over the years I tried more complex and “smart” solutions, but nothing beats this spreadsheet. Just like with our investment philosophy, simple truly is better than complex (thanks, PEP 20).
I extracted the allocation sheet from our mega-spreadsheet: feel free to copy Ruslan’s Allocation Sheet and tinker with it to your liking.